What Is Breakout Trading and How to Avoid Fakeouts in 2026
FiveTec Editorial Team | Published on October 28, 2026 | 10 min read

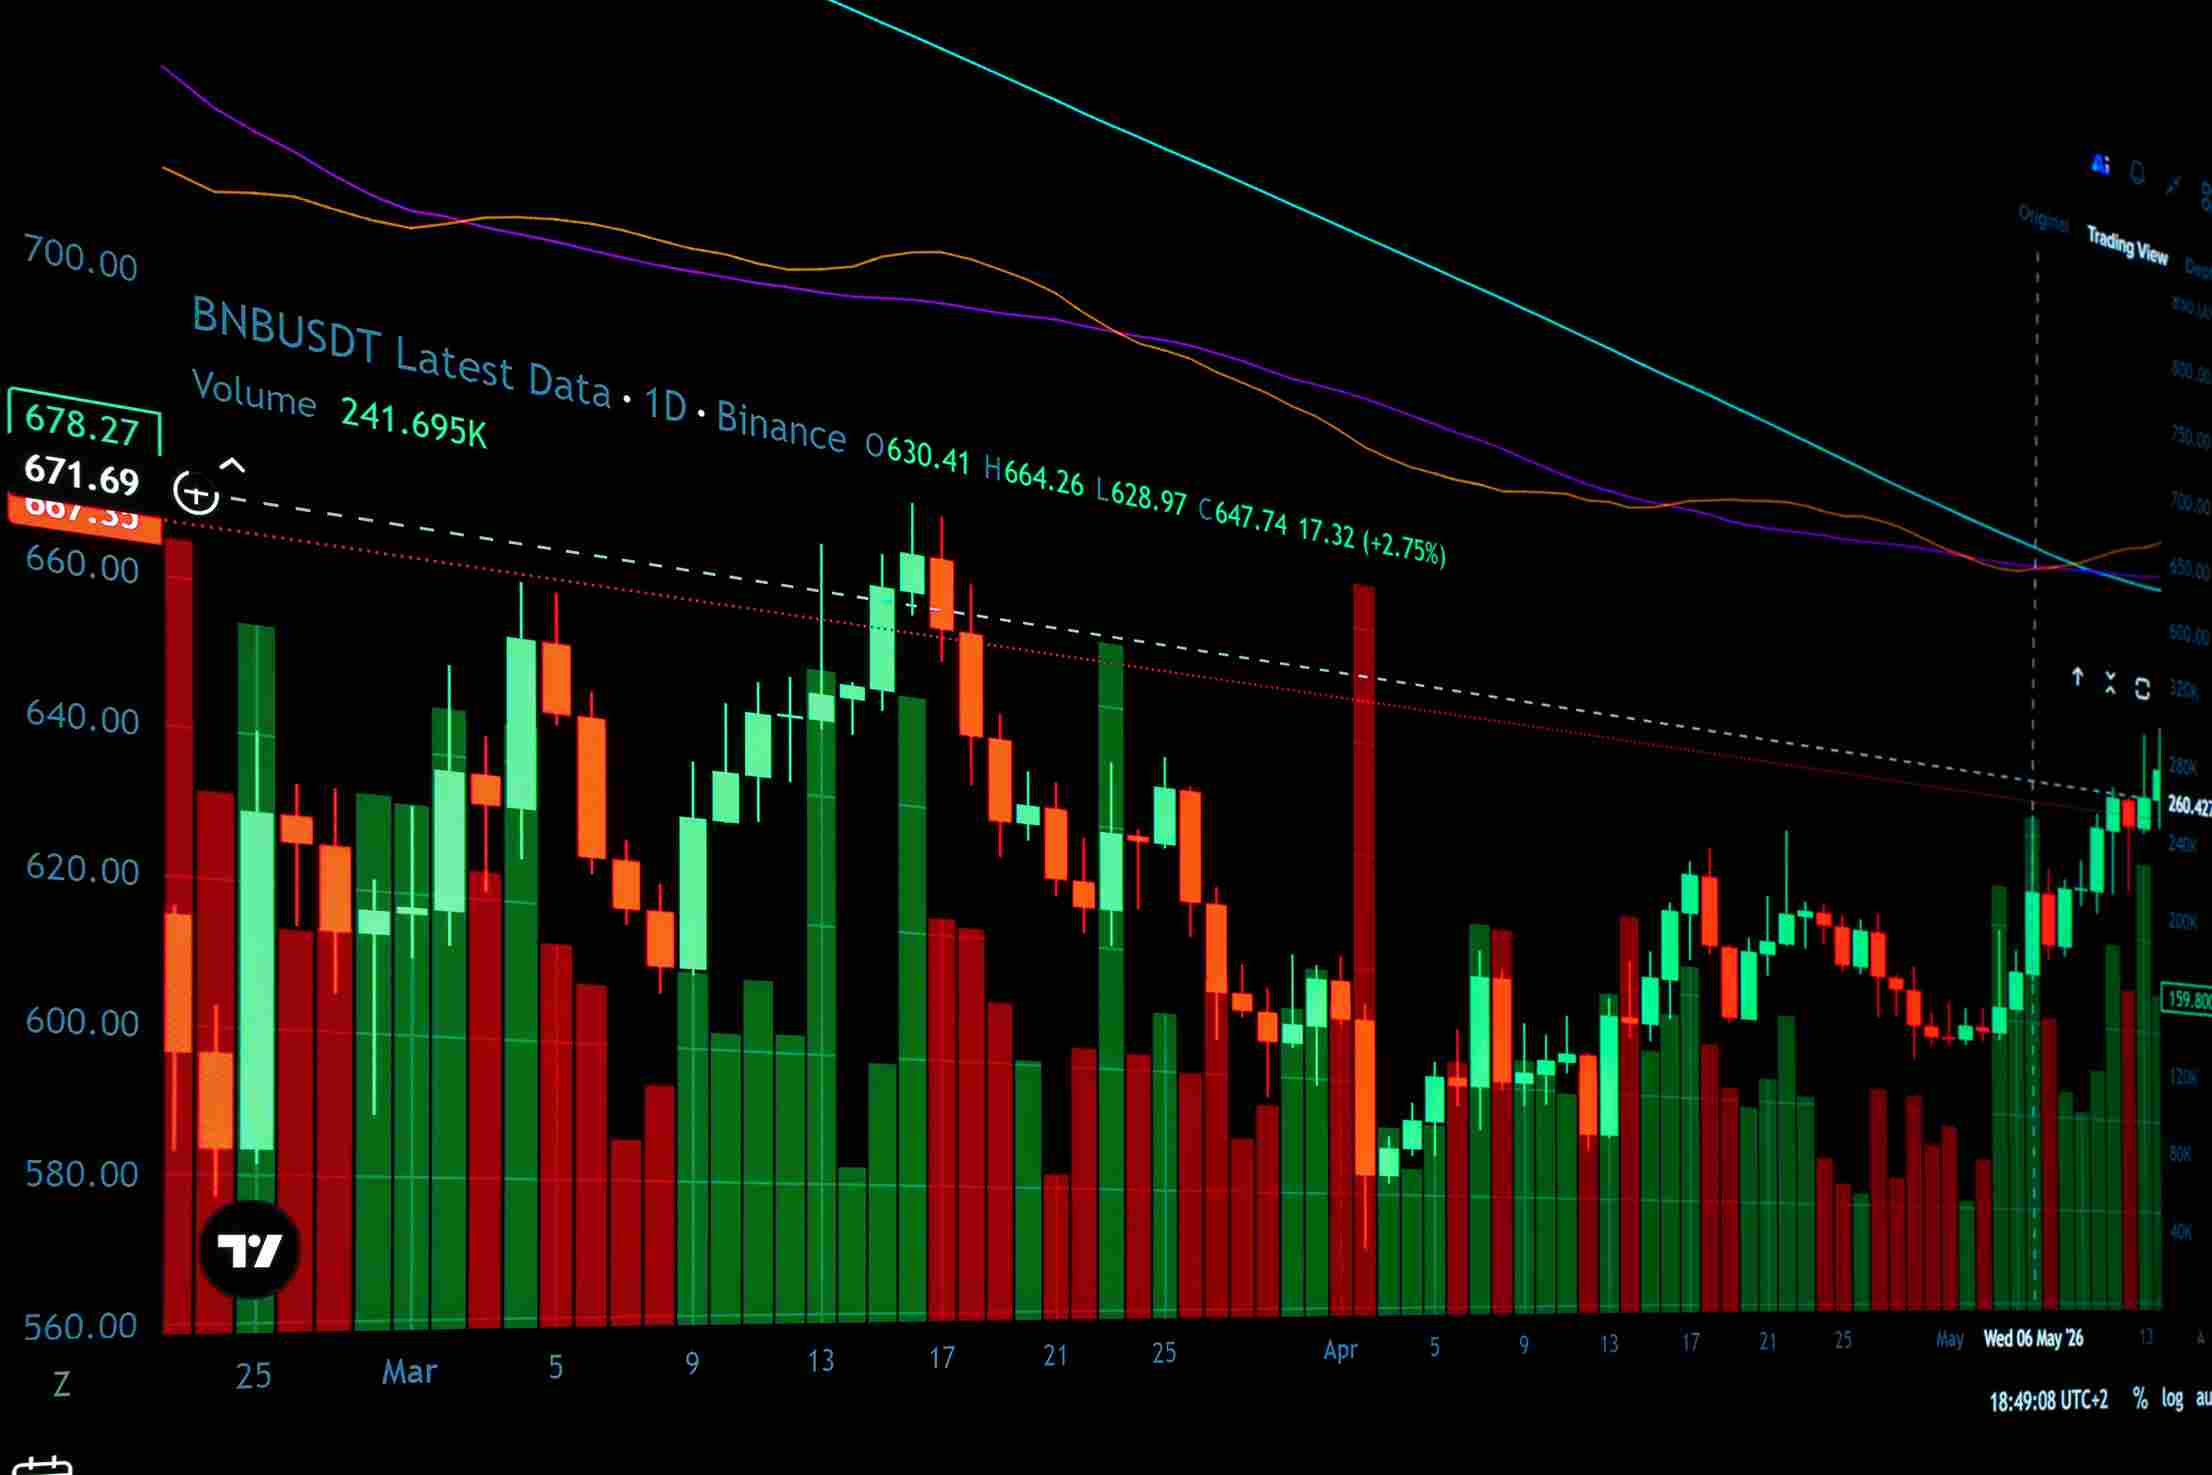 Breakout trading looks like the most logical strategy in the world when you first learn it. Price has been stuck in a range. It finally breaks above resistance. You buy. The trend begins. Profit. The problem starts the moment you try to do this on live charts, where approximately 64 percent of apparent breakouts turn out to be fakeouts that reverse into the range within hours, taking out your stop loss and often triggering a move in the opposite direction.
This fakeout rate is why so many retail traders at FiveTec Global Capital initially fall in love with breakout trading and then quietly abandon it after their first six to eight consecutive losses. The strategy is not broken. The way most retail traders execute it is broken. There is a specific framework that filters out the majority of fakeouts and keeps breakout trading genuinely profitable in 2026 market conditions.
Let me walk you through exactly what breakout trading is, why fakeouts are so common, and the specific five-filter checklist that separates real breakouts from the fakes, based on current market behaviour heading into the final quarter of 2026.
The Direct Answer
Breakout trading is a strategy that enters positions when price moves decisively through a significant support or resistance level, aiming to capture the new trend that typically follows. In practice, roughly 64 percent of initial breakout attempts fail and reverse back into the previous range, which is why successful breakout traders use multiple confirmation filters before entering rather than taking every breakout at face value. The five filters that genuinely improve breakout success rates are volume expansion on the breakout candle, higher timeframe alignment, the retest pattern, time-of-session filtering, and the proximity of major news events. Breakout trading works best during trending markets and performs worst during low-volatility consolidation phases. For traders unsure which style suits them better, our guide on trend following vs counter-trend trading explains how breakout strategies fit into the broader trend-following framework.
What Actually Causes a True Breakout vs a Fakeout
Every trader at FiveTec Global Capital should understand the four specific market dynamics that determine whether a breakout holds or fails. Miss these and you may trade clean technical setups that consistently produce losses.
Order flow at the breakout level. True breakouts occur when there is genuine new buying (or selling) pressure that absorbs the existing orders at the level and continues pushing beyond it. Fakeouts occur when limited retail buying pushes price just beyond the level, triggers resting stop orders from traders positioned the other way, and then exhausts without institutional follow-through.
Stop-loss hunting by larger players. Institutional traders often deliberately push price just past obvious support or resistance levels to trigger retail stop losses and generate liquidity for their own larger positions. This creates the classic pattern where price breaks a level, moves 10 to 20 pips beyond, triggers retail stops, and immediately reverses. Understanding this is why professional breakout traders rarely enter at the exact breakout moment.
Session-driven false moves. Breakouts that occur during low-liquidity sessions (particularly late Asian hours or Friday afternoons) have significantly higher fakeout rates than breakouts during the London or New York sessions. The lower volume makes false breaks easier to produce and harder to sustain.
News-driven exhaustion. Breakouts that occur in the final minutes before a major scheduled news event often reverse violently when the news hits because the pre-news positioning gets unwound rapidly. Checking the economic calendar before any breakout entry is essential rather than optional.
The Five Filters That Separate Real Breakouts From Fakeouts
Here is the specific checklist I use before taking any breakout trade. Trades that pass all five filters have dramatically higher success rates than trades that pass only two or three.
Filter 1: Volume expansion on the breakout candle. On indices like NAS100 and US30, true breakouts typically show tick volume expansion of 50 percent or more compared to the preceding 20 candles. On forex pairs where volume data is less reliable, use the Average True Range (ATR) as a proxy. If the breakout candle is significantly larger than recent average, that is confirmation. If the breakout happens on a tiny candle that barely edges past the level, it is almost always a fakeout.
Filter 2: Higher timeframe alignment. Before taking a breakout on the 15-minute chart, check the 4-hour and daily charts. If the higher timeframes show the market in a clear trending direction that matches your breakout direction, your probability improves dramatically. If the higher timeframes show the market in a defined range or trending against your breakout direction, you are fighting the current, and fakeout probability increases substantially.
Filter 3: The retest pattern. This is the single most powerful fakeout filter available to retail traders. Instead of entering at the moment of breakout, wait for price to break the level, move beyond it by 10 to 30 pips, pull back to retest the broken level, and then resume in the breakout direction. The retest confirms that the broken level has flipped from resistance to support (or vice versa), which is characteristic of genuine breakouts rather than fakeouts.
Filter 4: Time-of-session filtering. The highest-probability breakouts on major forex pairs and indices occur during the London-New York session overlap (12:00 to 16:00 UTC). Breakouts during the Asian session, around daily close, or on Fridays after 15:00 UTC have statistically higher fakeout rates. Trading only during active sessions filters out a significant percentage of low-quality setups automatically.
Filter 5: Clear calendar check. Before any breakout entry, verify there are no high-impact news releases scheduled within the next two hours that could reverse your position. Non-farm payrolls, Fed decisions, CPI releases, and ECB announcements all have the power to invalidate breakout setups within minutes of release.
A Real Breakout Trade Setup
Let me walk you through the exact approach I use, with October 2026 market conditions as context.
Say USD/JPY has been consolidating between 148.50 and 150.20 for the past two weeks following the September Fed cut. The daily chart shows a clear higher-timeframe uptrend that was interrupted by this consolidation. On a Tuesday during the London-New York overlap, price breaks above 150.20 to 150.45 on a candle that is 1.5 times the recent average size, with no high-impact news scheduled for the rest of the session.
The entry approach:
- Do not enter at the initial breakout (150.45)
- Wait for the retest back to 150.20 to 150.30
- Enter only if the retest holds and shows rejection (bullish candle pattern)
- Entry: 150.35 (buffer above retest confirmation)
- Stop loss: 149.95 (40 pips below broken level with buffer)
- Take profit: 151.60 (125 pips, next major resistance zone)
- Risk-reward: approximately 1 to 3.1
This setup trades the breakout but only after the market confirms the level has flipped and institutional stop-hunting has already played out. The retest wait filters out the vast majority of the 64 percent fakeout rate. Position sizing follows the standard 1 percent risk rule — the complete risk management framework covers how to size trades like this correctly across your account.
When Breakout Trading Works Best Versus When It Struggles
Being honest about this matters because applying breakout logic in the wrong environment produces consistent losses even when individual trade analysis is perfect.
Breakout trading works best during: Trending markets with clear higher highs and higher lows, periods following major fundamental catalysts (central bank decisions, significant data releases), ascending triangle and descending triangle formations near completion, breakouts from tight consolidation after extended trending moves (continuation patterns), and sessions with elevated volatility and clear directional flow.
Breakout trading struggles during: Range-bound markets where levels keep failing to break and sustain, low-volatility periods (summer trading, holiday weeks), markets near all-time highs or lows without clear catalysts, periods of elevated geopolitical uncertainty where whipsawing is common, and the hour before major scheduled news events.
Identifying the current market environment before you start trading is at least as important as any specific technical setup. Technical analysis for beginners covers the chart reading foundations that help you identify which regime you are currently facing.
The Three Mistakes New Breakout Traders Make Most Often
I see the same three mistakes constantly in traders learning breakout strategies at FiveTec Global Capital. Fix these and your breakout trading improves dramatically.
Entering at the initial breakout without waiting for retest confirmation. This single mistake accounts for the majority of fakeout losses. The initial breakout is often engineered by larger players to trigger stops. Waiting for the retest filters out the engineered false breaks and only takes you long in genuine breakouts where the level actually flipped.
Ignoring higher timeframe context. Taking a 15-minute chart breakout to the upside when the daily chart is in a clear downtrend produces consistent losses. The higher timeframe trend wins the vast majority of the time regardless of what the lower timeframe shows. Always confirm higher timeframe alignment before trading any breakout.
Oversizing because the setup "looks obvious." A clean breakout from a well-defined range feels like a high-probability trade, which creates emotional pressure to size up. The 64 percent fakeout rate applies even to beautiful-looking setups. Position size should remain the same for every trade regardless of how confident you feel, which protects your account during the inevitable losing streaks that even skilled breakout traders experience. If a losing streak does develop, the proper framework for recovering from losing streaks applies as much to breakout traders as to any other style.
Frequently Asked Questions About Breakout Trading
What is the actual win rate on well-executed breakout strategies?
With proper filtering using the five-filter checklist above, win rates typically run 40 to 50 percent with average risk-reward of 1 to 2.5 or higher. Without proper filtering, win rates can drop to 25 to 35 percent, which is why most retail breakout traders lose money despite the strategy being fundamentally sound.
Which forex pairs work best for breakout trading?
Major pairs with clean trending behaviour work best. EUR/USD, GBP/USD, USD/JPY, and major commodity pairs like AUD/USD produce cleaner breakouts than exotic pairs or heavily managed crosses like EUR/CHF. Breakouts on exotics are often distorted by thin liquidity and institutional intervention.
Can you use breakout trading on indices like NAS100 and US30?
Yes, and 2026 has been a particularly good environment for index breakouts due to the sustained Fed cutting cycle and AI-driven momentum. Both NAS100 and US30 at FiveTec Global Capital have produced multiple clean breakout opportunities throughout the year, though the 64 percent fakeout rate still applies.
What timeframes are best for breakout trading?
Higher timeframes produce cleaner breakouts with lower fakeout rates. The 4-hour and daily charts typically produce the highest-quality setups. The 15-minute and 1-hour timeframes can work but require stricter filtering because fakeout rates are higher on faster charts.
Should you trade breakouts during news events?
Generally no, unless you specifically specialise in news trading. Breakouts triggered by news events often reverse within minutes of the initial move as positioning unwinds. Letting the news dust settle for 15 to 30 minutes before considering a breakout entry filters out most news-driven whipsaws.
How much capital do you need to trade breakouts effectively?
Any account size can trade breakouts technically, but accounts under $500 struggle with the drawdown periods that are statistically normal for breakout strategies. A realistic minimum for serious breakout trading is $1,000 to $2,000, which allows proper position sizing while surviving the normal losing streaks that come with 40 to 50 percent win rates.
Can you combine breakout trading with other strategies?
Yes, but keep them separate. Breakout trades should follow breakout rules from entry to exit. Counter-trend or range-trading setups should follow their own rules. Mixing the logic mid-trade (such as holding a failed breakout and converting it into a counter-trend reversal play) is strategy abandonment rather than flexibility.
Related Reading on FiveTec Global Capital
For readers who want to go deeper into the specific topics mentioned throughout this guide, these related FiveTec Global Capital articles cover the operational and strategic foundations that support successful breakout trading:
-
Trend Following vs Counter-Trend Trading: Which Style Suits You — Understand how breakout trading fits within the broader trend-following framework and whether this style matches your personality.
-
Technical Analysis for Beginners — Master the chart reading foundations required for identifying support, resistance, and the market environments where breakouts work.
-
Risk Management: The Complete Framework for Traders — Learn the position sizing and stop loss discipline that keeps breakout trading survivable through the inevitable fakeout losses.
-
The Psychology of Trading: Emotions, Discipline, and Decision-Making — Build the emotional discipline required to pass on 64 percent of apparent breakout setups and wait for proper confirmation.
-
How to Build a Trading Journal and Why Every Trader Needs One — Track your breakout win rates by filter combination to discover which specific confirmations produce the best results for your trading style.
-
What Is a Demo Account and Why Every Trader Should Start With One — Practice the five-filter checklist on demo trades before committing live capital to breakout setups.
-
Can You Trade NAS100 and US30 at FiveTec Global Capital — Apply breakout trading principles to the two most actively trending indices through 2026.
Risk Disclosure
Trading forex and CFDs at FiveTec Global Capital involves significant risk and may not be suitable for all investors. Between 74 and 89 percent of retail CFD accounts lose money according to European regulatory data. Breakout trading strategies carry substantial risk of loss, including the 64 percent fakeout rate referenced throughout this guide. Statistics cited (win rates, fakeout percentages, risk-reward ratios) represent general industry benchmarks for well-executed strategies and will vary significantly based on individual implementation, market conditions, and risk management discipline. The USD/JPY trade setup example provided uses illustrative prices and conditions as of now and does not constitute a specific trading signal or recommendation. Past performance of any strategy is not indicative of future results. This content is for educational and informational purposes only and does not constitute financial advice or a trading recommendation. Always conduct independent research, practice strategies thoroughly on a demo account, and consider seeking advice from a qualified financial professional before making trading decisions.